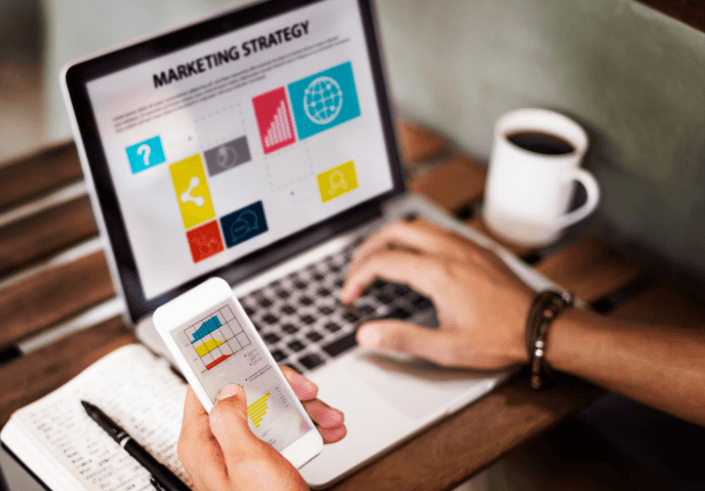
Data analytics for business is the process of collecting, cleaning and examining your company’s data to find patterns that improve decisions. Indian companies sitting on CRM records, sales logs, website traffic and customer feedback already have the raw material. The missing piece is a system that turns those numbers into actions — and that is exactly what EdgeNRoots builds for growing businesses.
Most Indian Businesses Sit on Data They Never Use
Every invoice, every website visit, every WhatsApp enquiry and every support ticket creates a data point. A mid-size company can generate tens of thousands of these records every month. The problem is not the volume. The problem is that most of this data stays locked inside disconnected spreadsheets, inboxes and billing software.
When the founder wants to know which product line is losing money or which sales rep closes the fastest, the answer takes days of manual work instead of seconds. Decisions end up resting on gut instinct, not evidence. That gap between data and decisions is where businesses leak revenue, overstock inventory, hire too late or chase the wrong customer segment.
Data analytics for business closes that gap by connecting scattered information into a single readable layer. Instead of pulling numbers from five different tools, the team sees dashboards, trends and alerts that point to the next smart move.
Where Data Analytics for Business Creates the Biggest Impact
Not every department needs the same depth of analysis. The smartest starting point is whichever area burns the most cash or holds the most untapped revenue. Here are four areas where the returns tend to show up fastest.
Customer Behaviour and Segmentation
Knowing that you had 5,000 orders last quarter is useful. Knowing that 60 percent of those orders came from repeat buyers in three cities, and that first-time buyers who received a follow-up within 24 hours converted at twice the rate, is transformative. Analytics breaks your customer base into segments based on purchase frequency, order value, geography, channel and response time. Marketing spend stops being a blanket effort and starts targeting the clusters that actually grow.
Revenue Forecasting and Cash Flow
Seasonal businesses, service companies with long payment cycles and subscription platforms all share one headache: unpredictable cash flow. Predictive analytics applies historical patterns, seasonality and external signals to forecast revenue weeks or months ahead. The finance team can plan hiring, inventory and vendor payments with confidence instead of surprises.
Operations and Supply Chain
Overstocking ties up capital. Understocking loses sales. Analytics models track sell-through rates, supplier lead times and demand signals to keep stock levels balanced. For service businesses, the equivalent is resource allocation — knowing which team is overloaded, which projects are slipping and where bottlenecks sit before they become emergencies.
Marketing Spend and ROI
Most Indian companies running digital campaigns track impressions and clicks but not the cost per qualified lead or the lifetime value of a customer acquired through a specific channel. A solid analytics layer connects ad spend to actual revenue. If your B2B digital marketing budget is split across Google Ads, LinkedIn and email, analytics tells you which channel earns money and which one only looks busy.
What a Data Analytics Setup Actually Looks Like
There is a common misconception that data analytics requires a team of data scientists and a six-figure budget. For most Indian SMBs and mid-market companies, the practical setup is far simpler.
The foundation is a clean data pipeline. This means connecting your CRM, billing software, website analytics and communication tools into a single database or warehouse. The data gets cleaned — removing duplicates, fixing formats, filling gaps — so that every report starts from accurate numbers.
On top of that pipeline sit BI tools like Tableau or Power BI, or custom-built dashboards depending on the complexity of the business. These tools visualise trends, generate scheduled reports and trigger alerts when a metric crosses a threshold. A logistics company might get an alert when delivery delays exceed a set percentage. A hotel chain might see a dashboard showing occupancy forecasts alongside local event calendars.
The advanced layer adds predictive modelling and machine learning. This is where the system moves from telling you what happened to telling you what is likely to happen next. Customer churn prediction, demand forecasting, pricing optimisation and fraud detection all sit at this level.
EdgeNRoots builds these layers using Python, SQL, and frameworks like Node.js and React for the interface. The architecture follows microservices principles so each component scales independently. Security follows ISO 27001 and NIST guidelines, and GDPR-compliant data governance ensures that customer information stays auditable and protected.
The Indian Market Is Moving Fast
India’s data analytics market reached an estimated USD 4.4 billion in 2026, up from USD 3.3 billion in 2025. Industry projections put it at USD 28.9 billion by 2034, growing at a 26.37 percent CAGR. Those numbers reflect a shift that is already visible on the ground: companies that once considered analytics a luxury now treat it as infrastructure.
The government’s Digital India push, the rise of UPI-driven transaction data, and the explosion of e-commerce and SaaS adoption have created a data-rich environment. Businesses that build their analytics capability now will compound the advantage over competitors still running on Excel and intuition.
At the same time, India’s advanced analytics segment, covering predictive modelling, AI-driven insights and autonomous decision engines, is projected to grow at over 21 percent CAGR through 2031. The window to start is not closing, but the cost of waiting is climbing.
How to Start Without Overcomplicating It
The biggest mistake companies make is trying to analyse everything at once. A phased approach works better and costs less.
Start with one business question. It could be as simple as “which of our ten products should we push harder next quarter” or “why do 40 percent of leads drop off after the first call.” Define the question, identify which data sources hold the answer, and build a focused dashboard or model around it.
Once that first use case delivers a measurable result, expand. Add a second department, connect more data sources, and introduce automated reporting. The team learns to trust the data, and the analytics system grows alongside the business instead of landing as a massive, overwhelming project.
This is exactly the collaborative process EdgeNRoots follows. The engagement starts by understanding your business goals, then building a roadmap, developing the solution with iterative feedback, and refining until the system earns its place in daily operations. There are no per-user licensing fees because the stack runs on open-source technology. And the free audit offered at the start means you see the opportunity before committing a rupee.
Turning Data Into Decisions Is No Longer Optional
Data analytics for business is not a trend to watch from the sidelines. It is the operational backbone that separates companies scaling with clarity from companies growing blind. Indian businesses already have the data. What they need is the system, the process and the partner to make that data speak.
If your team is still spending hours pulling reports manually, or if your last strategic decision was based on a hunch rather than a number, it is time to change that. Request a free audit and see what your data is already trying to tell you.
Frequently Asked Questions
What is data analytics for business?
It is the process of examining company data to find patterns that improve decisions and revenue.
How much does a data analytics setup cost in India?
Costs vary by scope, starting from a few lakhs for focused dashboards to larger investments for enterprise systems.
Which industries benefit most from business analytics?
E-commerce, hospitality, logistics, healthcare and financial services see the fastest measurable returns from analytics.
Do small businesses need data analytics?
Yes, even basic sales and customer data analysis helps small businesses cut waste and target better.
How long does it take to see results from data analytics?
Most companies see actionable insights within four to eight weeks of setting up the first focused dashboard.